

The S&P 500 is off to a great start in 2018. Following a historic 12 straight months of positive returns in 2017, the rally continues into the new year as the index is up about 5% so far.
This is always the time of year that many investors begin talking about the “January Indicator” or “January Barometer.”
This theory suggests that the price movement of the S&P 500 during the month of January may signal whether that index will rise or fall during the remainder of the year. In other words, if the return of the S&P 500 in January is positive, this would supposedly foreshadow a rise for the stock market for the remainder of the year, and vice versa if returns in January are negative.
So have past Januarys’ S&P 500 returns been a reliable indicator for what the rest of the year has in store? If returns in January had been negative, should investors have sold stocks?
Exhibit 1 shows the monthly returns of the S&P 500 Index for each January since 1926, compared to the subsequent 11-month return (i.e., the return from February through December).
Exhibit 1. January Return vs. Subsequent 11-Month Return of the S&P 500 Index (1926–2017)
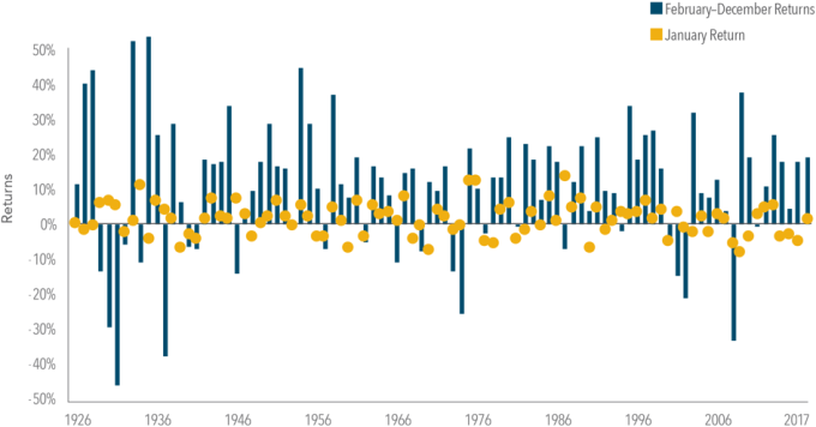
In US dollars. S&P 500 Index data provided by Standard & Poor’s Index Services Group. Past performance is not a guarantee of future results. Indices are not available for direct investment; therefore, their performance does not reflect the expenses associated with the management of an actual portfolio.
A negative return in January was followed by a positive 11-month return about 60% of the time, with an average return during those 11 months of around 7%.
This data suggests there may be an opportunity cost for abandoning our stock investments after a disappointing January. Take 2016, for example: The return of the S&P 500 during the first two weeks was the worst on record for that period, at -7.93%.
Even with positive returns toward the end of the month, the S&P 500 returned -4.96% in January 2016, the ninth-worst January return observed from 1926 to 2017. But a subsequent rebound of 18% from February to December resulted in a total calendar year return of almost 13%.
An investor reacting to January’s performance by selling out of stocks would have missed out on the gains experienced by investors who stuck with equities for the whole year. This is a good example of the potential negative outcomes that can result from following investment recommendations based on an “indicator.”
Conclusion
Over the long term, the financial markets have rewarded investors. People expect a positive return on the capital they supply, and historically, the equity and bond markets have provided meaningful growth of wealth.
As investors prepare for 2018 and what the year may bring, we should remember that frequent changes to an investment strategy can hurt performance. Rather than trying to beat the market based on hunches, headlines, or indicators, investors who remain disciplined can let markets work for them over time.